Service graphs
Graph Information
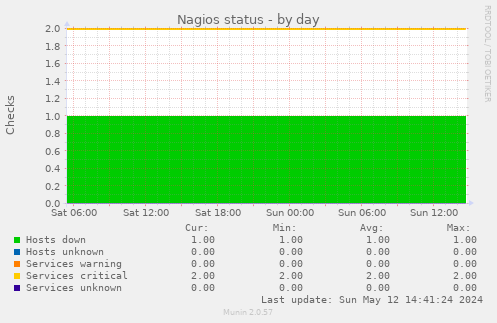
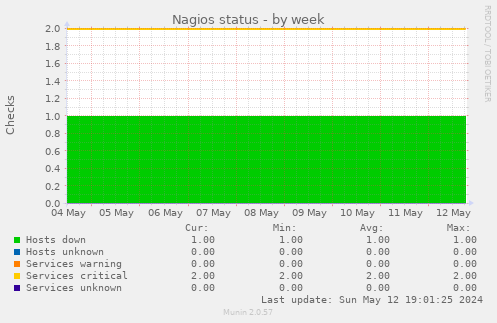
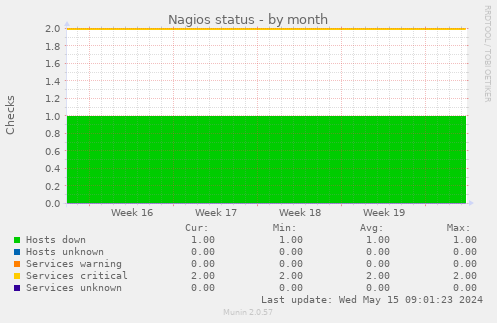
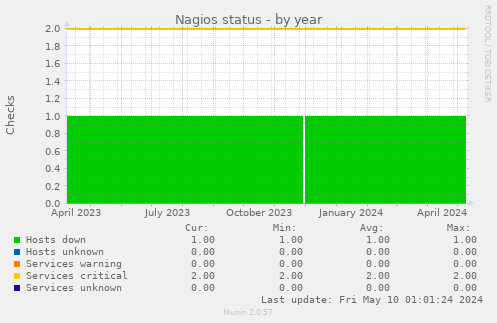
This graph shows how many Nagios checks are in warning or critical state.
| Field |
Internal name |
Type |
Warn |
Crit |
Info |
| Hosts down |
hdown |
gauge |
|
|
Number of Nagios hosts in DOWN state |
| Hosts unknown |
hunknown |
gauge |
|
|
Number of Nagios hosts in UNKNOWN state |
| Services warning |
swarning |
gauge |
|
|
Number of Nagios services in WARNING state |
| Services critical |
scritical |
gauge |
|
|
Number of Nagios services in CRITICAL state |
| Services unknown |
sunknown |
gauge |
|
|
Number of Nagios services in UNKNOWN state |